
Facebook Ad Metrics are key factors to watch out for when running ads on Facebook, Messenger, Instagram etc.
Running Facebook ads is profitable for your business but can be tiring and confusing especially when you are bombarded with numbers and many marketing and sales terminologies.
Knowing the right Facebook ad metrics to track will make your ad experience easier and more effective.
These metrics are crucial for measuring ad performance, optimizing campaigns, and maximizing return on investment (ROI).
In this guide, we’ll break down key Facebook Ad Metrics, explain how they impact your campaign, and show you how to use them to optimize Facebook Ads properly.
Key Facebook Ad Metrics to Monitor for Better Campaign Performance
Not all metrics hold equal weight. The following are the main metrics you would find on your Facebook Ad Account page.
- Performance Metrics
- Cost Metrics
- Engagement Metrics
- Delivery Metrics
Let’s break down the key Facebook Ad Metrics that truly impact campaign success and are the real-world benchmarks to improve your advertising strategy.
1. Performance Metrics
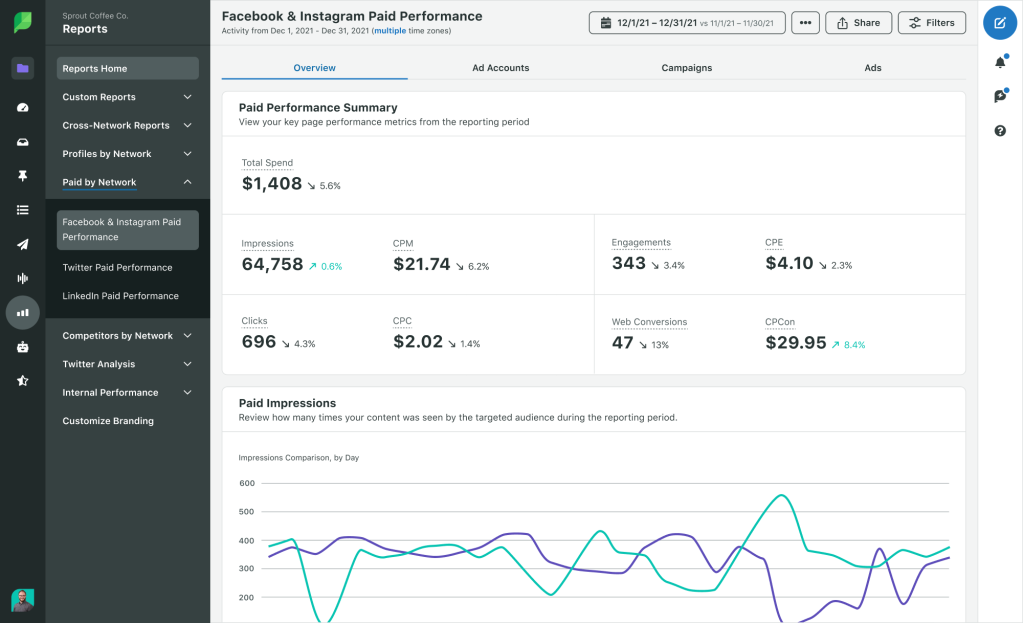
A Facebook Ad Performance Metrics page (Not on Meta Ads Manager)
When running Facebook ads, it’s important to monitor how well your ads are performing and achieving your overall business goals.
Performance metrics help assess how well your ads are driving user actions.
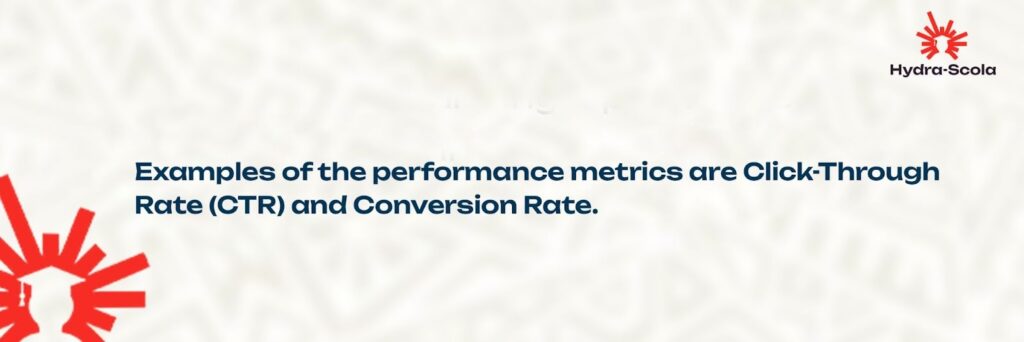
Examples of the performance metrics are Click-Through Rate (CTR) and Conversion Rate.
They are key in understanding the relevance of your ads to your target audience and their effectiveness in prompting engagement and conversions.
a. Click-Through Rate (CTR)
As it suggests, CTR measures the percentage of users who click on your ad after seeing it. A low CTR is a testament to a poorly targeted ad or not-so-engaging ad creative. A high CTR suggests that your ad is engaging, relevant and compelling.
The average Facebook ad CTR across industries is (0.90%), but industries like legal services typically have lower averages (0.45%), while e-commerce often sees higher CTRs (1.59%).
To calculate the CTR of your ad: Divide your total clicks by the total impressions and multiply by 100.
CTR (%) = (Total Clicks / Total Impressions) x 100
The following are ways to improve the CTR of your Facebook ads;
- Boost your ad copies with a clear call to action (CTA) for your audience.
- Use high-quality graphics or videos tailored to your target audience.
- Test your ads against different audience segments to understand customer wants and better optimize your targeting.
b. Conversion Rate
Most ad campaigns are started to actualize certain goals such as sign-up or purchases. Conversion rate is the Facebook ad metric telling you how many users completed your desired action after clicking your ad.
A high conversion rate is good news. It speaks volumes to the optimization of your landing page, audience targeting, relevance of your ad and the power of your offer.
Conversion Rate (%) = (Total Conversions / Total Clicks) x 100
The average Facebook ad conversion rate is 9.21%. Your rate should vary above or below the average depending on your ad relevance and understanding of your audience.
You can boost conversion rate by retargeting your ads to the target audience that interacted with your ads but didn’t convert. (The second or third time might be the charm).
| Performance metrics | Formula |
| Click-through rate | CTR (%) = (Total Clicks / Total Impressions) x 100 |
| Conversion rate | Conversion Rate (%) = (Total Conversions / Total Clicks) x 100 |
2. Cost Metrics
A Facebook Ads Cost Metrics page.
A poorly targeted Facebook ad is financially damaging to a business. Cost metrics give insights into the financial productivity of your campaigns.
To measure your Facebook ad success under cost metrics, look out for;
- Cost Per Click (CPC)
- Cost Per Acquisition/Conversion (CPA)
They help you understand how much you are spending to drive engagements and conversions.
a. Cost Per Click (CPC)
CPC represents the amount you pay for each click on your ad. A lower CPC means more traffic at a lower cost, improving overall return on investment (ROI).
CPC = Total Ad Spend / Total Clicks
Facebook’s average CPC across all industries is $1.72. Finance and Insurance industries see CPC as high as $3.77, while other industries average $0.45.
(CPC differs across markets. CPCs for advertisers targeting First World Countries are usually higher than those of advertisers targeting Third World Countries)
The goal of every business is to reduce CPC. You can reduce the Cost per Click of your business by;
- Testing different ad creatives and headlines to find the most engaging ones.
- Use audience segmentation to refine targeting.
- Leverage A/B testing to determine the best-performing ad variations.
b. Cost Per Acquisition/Conversion (CPA)
The average CPA on Facebook varies by industry, with education at $7.85, technology at $55.21, and retail at $21.47.
(It is not uncommon to see numbers in certain markets and industries fall way below these averages)
CPA measures the cost to achieve a conversion. A high CPA may indicate poor audience targeting, weak ad creatives, an unoptimized landing page, or an unappealing offer.
CPA = Total Ad Spend / Total Conversions
You can reduce the CPA of your ads by optimizing the ad relevance. Target high-intent users who have already shown interest in purchasing your product or demanding your service.
Experimenting with different bidding strategies can also maximize the efficiency of your ads.
| Cost Metrics | Formula |
| Cost Per Click (CPC) | CPC = Total Ad Spend / Total Clicks |
| Cost Per Conversion (CPA) | CPA = Total Ad Spend / Total Conversions |
3. Engagement Metrics (Likes, Comments, Shares)
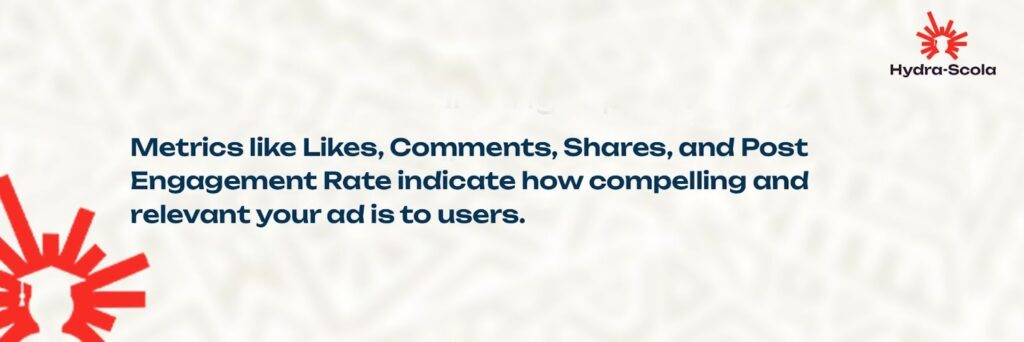
Metrics like Likes, Comments, Shares, and Post Engagement Rate indicate how compelling and relevant your ad is to users.
Better targeted, engaging and relevant ad content will boost user engagement.
High engagement often translates to increased organic reach and lower ad costs due to better relevancy.
Post Engagement Rate (%) = (Total Engagements / Total Reach) x 100
Find more in-depth info on how to increase Facebook Audience Engagement in this video: https://www.youtube.com/watch?v=Bam_rXmoOs4
4. Delivery Metrics (Impressions, Reach, and Frequency)
These delivery metrics terms would come up a lot during ad campaigns. Many times they can be used interchangeably if not properly understood;
| Delivery Metrics | Definition |
| Impressions | The total number of times your ad was displayed |
| Reach | The number of unique users who saw your ad |
| Frequency | The average number of times a person sees your ad |
While these metrics can be positively assuring, they can also inform you of negative updates such as Ad fatigue.
How to Use Facebook (Meta) Ads Manager to Track These Metrics

To track these Facebook Ad Metrics in Facebook Ads Manager:
- Go to Facebook Ads Manager and select your campaign.
- Customize columns to display CTR, CPC, CPA, conversion rate, and engagement metrics.
- Use breakdown filters to analyze performance by age, gender, location, or device.
- Compare historical data to identify trends and opportunities for optimization.
Why Facebook Ad Metrics Matter
Running a successful ad campaign demands specific data-driven efforts. Running on blind data for an ad campaign can result in
- Targeting the wrong audience
- Wasting your budget on ineffective ads
- Missing opportunities to scale campaigns
By tracking the right Facebook ad performance indicators, you’ll gain insights that help you improve engagement, reduce costs, and increase conversions.
Frequently Asked Questions (FAQs)
- How to check Facebook ad frequency?
To check how often your ads are shown, go to Ads Manager and adjust the timeframe. Select the campaign, ad set, or ad you want to review and track its frequency by day, week, two weeks, or month.
- What is the difference between impressions and reach?
The key difference is in how they track exposure. Reach measures the number of unique people who saw your content at least once, while impressions count the total times it was displayed, including multiple views by the same person.
- What are unique clicks in Facebook ads?
Unique clicks refer to the total number of individual users who clicked on a link in your campaign. Unlike total clicks, which count every click (even multiple ones from the same user), unique clicks only count each person once, no matter how many times they click.
- What is a good CTR?
A good CTR depends on various factors, including your industry and ad type. On average, search ads have a CTR of 3.17%, while display ads typically see a lower CTR of 0.46%. A strong CTR means your ad is relevant and engaging to your audience.
Conclusion
Monitoring your Facebook Ad Metrics is key to running profitable campaigns. By monitoring the right Facebook Ads Manager metrics, you can identify what’s working, reduce or prevent ad spend waste, and improve your Facebook Ad ROI.
Once you start tracking the key Facebook ad metrics, you are on your way to optimizing Facebook ads for better engagement, lower costs, and higher conversions.

I write like I talk - curious, At Hydra-Scola, amongst other things, I obsess over why campaigns click.


